Read More
This Index Insights Monthly Scorecard provides an update on the performance of dozens of indices that track the levels of volatility or the performance of hypothetical strategies that invest in options or futures.
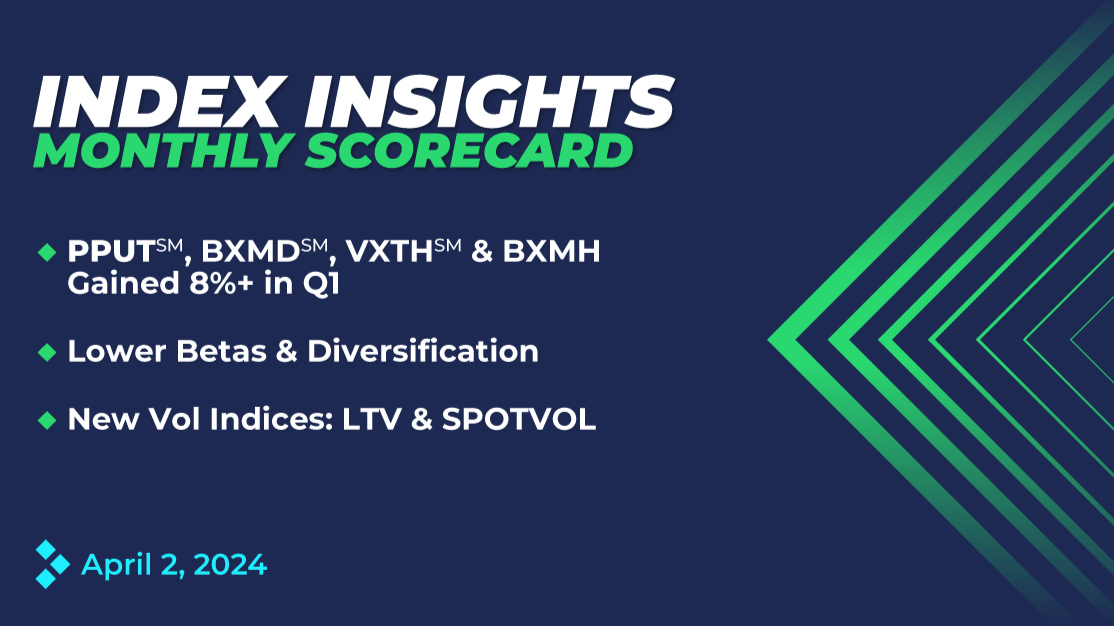
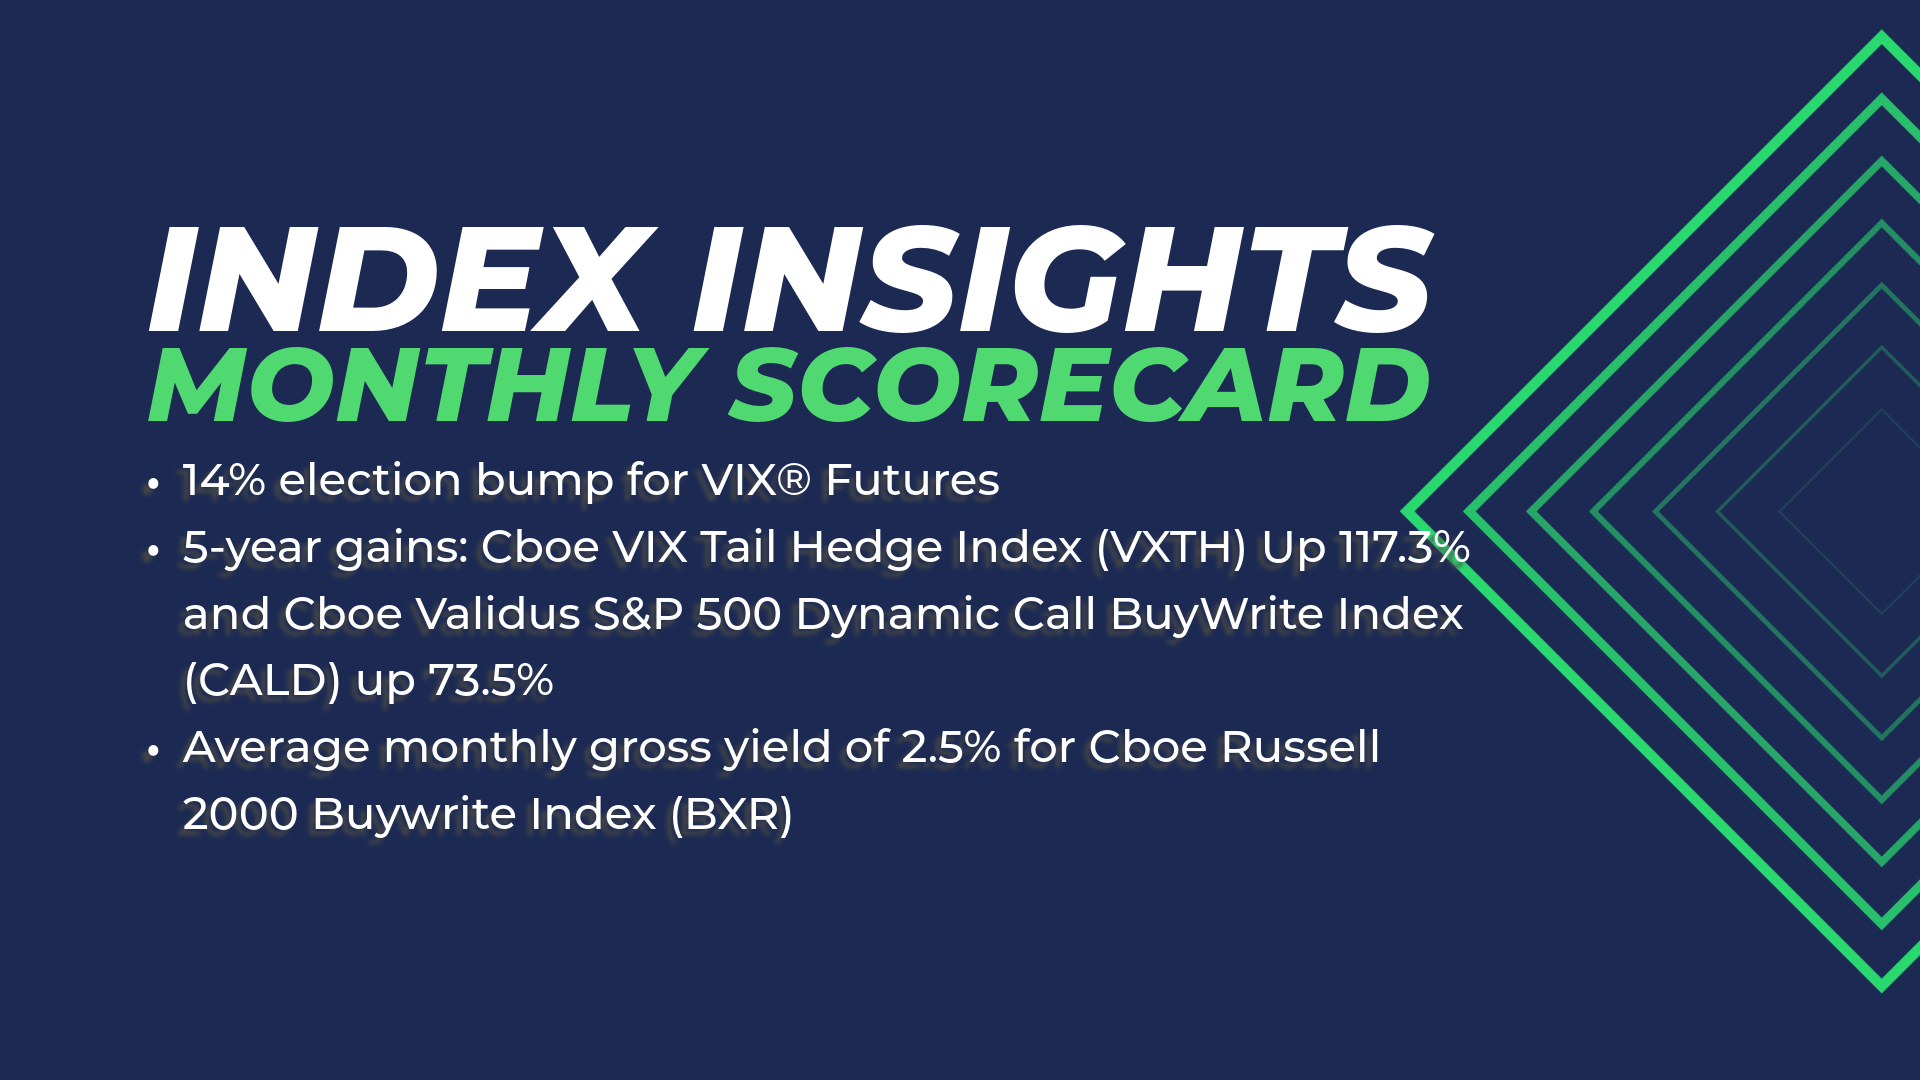
Highlights:
In August 2023 the S&P 500® Index experienced its first monthly decline in six months, as investors coped with factors such as higher bond yields, possible interest rate increases, geopolitical tensions, and economic problems in China. September has been the worst calendar month in terms of average performance of the S&P 500 Index since 1928. Some Cboe strategy indices can help mitigate downside risk by following hypothetical strategies that take hedging positions or collect options premiums.
The table below shows that these four Cboe indices all rose by more than 19% in the first eight months of 2023:
Source: Cboe Global Indices
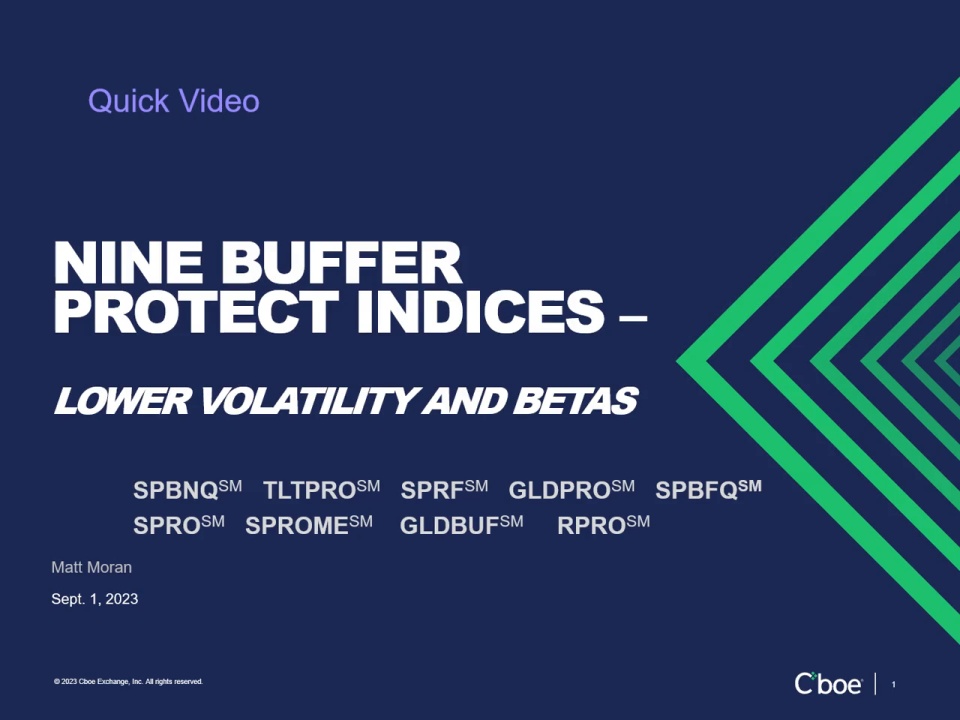
Over the past five years the interest in buffer protect strategies and indices has increased tremendously. Cboe offers several buffer protect indices and series as part of a family of Target Outcome Indices. The buffer protect indices generally are designed to provide target outcome returns, with buffered protection against a certain percentage of losses, while providing upside participation up to a capped level. The table below shows that nine of Cboe’s buffer protect indices and series had lower standard deviations and betas than the S&P 500 and Russell 2000 stock indices. To learn more, please click on the webpage links in the table.
Sources: Zephyr and Cboe Global Indices
For more information on Buffer Protect Indices, please watch this short video:
The table and line chart below show that the average daily closing levels in July 2023 were below longer-term averages for both the Cboe VIX of VIX Index (VVIXSM) and the Cboe Volatility Index® (VIX® Index). In regimes in which there are below-average levels for these indices, the buyers of index options may find that the premiums for options may be more affordable than regimes when the index values are much higher.
Source: Cboe Global Indices
Learn More
Learn more about Cboe Global Indices and related options and futures strategies:
There are important risks associated with transacting in any of the Cboe Company products or any digital assets discussed here. Before engaging in any transactions in those products or digital assets, it is important for market participants to carefully review the disclosures and disclaimers contained at: https://www.cboe.com/us_disclaimers/. These products and digital assets are complex and are suitable only for sophisticated market participants. These products involve the risk of loss, which can be substantial and, depending on the type of product, can exceed the amount of money deposited in establishing the position. Market participants should put at risk only funds that they can afford to lose without affecting their lifestyle. © 2023 Cboe Exchange, Inc. All Rights Reserved.