


Read More
The U.S. equity market landscape is constantly evolving. For example, in 2023, the total number of Initial Public Offerings (IPOs) dropped to 181, down from 1,035. Additionally, U.S. corporate bankruptcy filings fell to a 13 year low at 391, and yet corporate market caps were negatively impacted by the Federal Reserve’s 7 percent interest rate hikes in 2022.
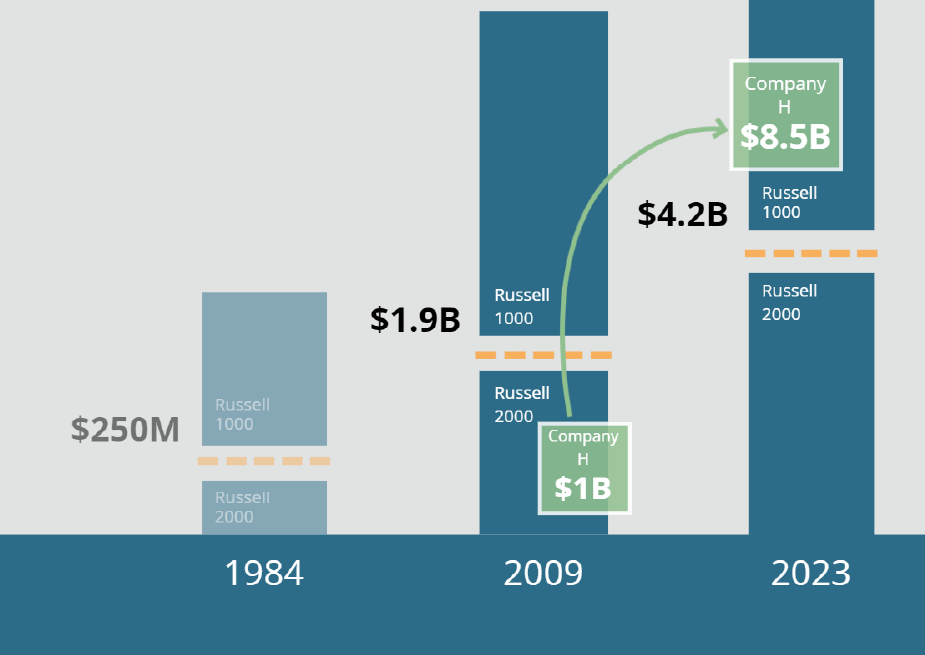
To reflect changes within the U.S. equity market, FTSE Russell annually recalibrates its widely followed U.S. Russell Indices using a process known as Russell Reconstitution. The annual Russell Reconstitution occurs between April 28 and June 23 and redefines the breakpoints between, large, mid and small-cap companies. A series of FTSE Russell announcements begin with a list of U.S. companies ranked by market cap in April and followed by weekly updates identifying constituents within the Russell 3000 Index to be shifted between the Russell 1000 or Russell 2000 Index.
Source: FTSE Russell
The process of Russell Reconstitution culminates into a Russell Rebalance where institutional investment managers adjust their investment holdings to mirror the new composition of the Russell Indices. The short-term adjustments typically lead to one of the highest trading volume days of the year in U.S. equity markets.
The Russell 2000 Index’s outperformance of U.S. small-caps over time, along with higher price volatility relative to U.S. large-caps, draw interest from options traders. As noted by Nobel Prize winning professors Eugene Fama and Kenneth French, a U.S. small-cap index may lead to outperformance, relative to a U.S. large-cap index over a long period, by virtue of the size of the constituents’ market cap.
Additionally, the divergent sector weightings within the Russell 1000 and Russell 2000 Indices will significantly affect the divergence of price performance between the indices. Within the Russell 1000, the largest sector weightings are currently Information Technology and Consumer Discretionary, respectively comprising 28.99% and 14.07% of the total weighting. Within the Russell 2000, the largest sector weightings are Health Care and Industrials, which respectively comprise 17.81% and 17.41% of the total weighting.
Source: Cboe Global Markets
Source: Cboe Global Markets
For further reference, Cboe® and FTSE Russell co-commissioned a white paper, The Biggest Opportunity in Small Caps: Mini-Russell 2000 Index Options, highlighting the different characteristics between the large-cap Russell 1000 Index and small-cap Russell 2000 Index. The whitepaper also explains trading strategies that use Mini-Russell 2000 Index options, including target outcome strategies used to generate income, enhance risk-adjusted returns, and hedge against downward price movements.
According to FTSE Russell, institutional and retail investors are invested in investment products that track the U.S. Russell Indices with approximately $10.6 trillion in assets under management. FTSE Russell carefully orchestrates the Russell Reconstitution process of rebalancing the indices to minimize market impact on the Russell Rebalance date when all Russell-tracking portfolios send their buy and sell orders to be executed on the close. In last year’s Russell’s Rebalance, more than $143 billion in U.S. equities traded, making it one of the most active volume days of the year.
Given the scope of Russell Recon, the potential for increased volatility due to the addition and subtraction of constituents is prevalent. Cboe’s Russell 2000 Volatility Index (RVX) is a widely followed benchmark calculating the 30-day expected volatility of the Russell 2000 Index. The RVX Index derives its value from implied volatilities on a series of Russell 2000 Index options and can serve as a barometer for market sentiment.
Typically, there’s an inverse relationship between the RVX Index and the Russell 2000 Index, the RVX Index tends to rise as pricing in the Russell 2000 Index declines. For many years, short-term volatility on the Russell 2000 Index has been muted during the Russell Recon period.
On average, the RVX Index has been 24.19%, reflecting that an expected 30-day price range in the Russell 2000 Index can be above or below 24%.
Source: Cboe Global Markets
It’s also worth noting that the RVX Index is muted between April and June, averaging 23.55. In other words, the Russell Recon process has successfully minimized market impact of rebalancing.
Cboe has created several Russell 2000 Strategy Benchmark Indices to measure the performance of various options-based strategies, such as the Russell 2000 BuyWriteSM Index (BXRSM), Russell 2000 30-Delta BuyWriteSM Index (BXRDSM) and the Russell 2000 cash-secured PutWriteSM Index (PUTRSM).
Investor’s ability to collect premiums from the sale of calls or puts is the primary benefit of these indices. Investors sell calls and puts on Russell 2000 benchmark indices to generate income or dampen volatility on the underlying index during the life of the options contract.
Considering the muted volatility of the Russell 2000 Index during the Russell Recon period, the following Russell 2000 Strategy Benchmark Indices outperform the underlying Russell 2000 Index 75% of the time as seen in the table below.
Source: Cboe Global Markets
During Russell Recon, market participants can express a market view, manage risks and trade volatility using cash-settled Russell Index options listed exclusively on Cboe. In comparison to ETF options, cash-settled Russell Index options offer several benefits including:
As one of the most actively traded index options on Cboe’s exchange, the Russell 2000 Index options (RUT) has an average daily volume of 55,600 contracts per day, up 37% compared to the previous year during Russell Recon, and an average daily notional of $9.8 billion. Additionally, in response to the increasing demand for a smaller notional contract, Cboe created Mini-Russell 2000 Index options (MRUT) with a notional value 1/10 the size of the index.
There are important risks associated with transacting in any of the Cboe Company products or any digital assets discussed here. Before engaging in any transactions in those products or digital assets, it is important for market participants to carefully review the disclosures and disclaimers contained at: https://www.cboe.com/us_disclaimers/. These products and digital assets are complex and are suitable only for sophisticated market participants. These products involve the risk of loss, which can be substantial and, depending on the type of product, can exceed the amount of money deposited in establishing the position. Market participants should put at risk only funds that they can afford to lose without affecting their lifestyle. © 2023 Cboe Exchange, Inc. All Rights Reserved.