Inside Volatility Trading: The Parallels Between Life and the Markets
Kevin Davitt
▬
June 1, 2021
We all mark our mental, physical, or digital calendars in some capacity. Birthdays, holidays, vacations, earnings, FOMC meetings, or simple grocery store reminders. We celebrate some anniversaries; we lament others.
I live in a town and gown community (Evanston, IL). As such, late May brings an annual reminder of “graduation season.” Another group of Northwestern University undergrads and advanced degree students will celebrate their academic achievement and venture off into disparate, uncertain futures.
Invariably, those festivities call to mind This is Water. On May 21, 2005, David Foster Wallace gave (arguably) one of the finest commencements addresses ever at Kenyon College. From my perspective, there’s so much “Capital-T, Truth” about life and living in Wallace’s discourse, much of which is widely relatable.
While I’m undoubtedly skewed by my own path, I listen and recognize many parallels between life/living and the markets. Both have tremendous, embedded uncertainty as well as the potential to create real value. There can be periods of profound frustration. Per Wallace, simple “awareness” can be the differentiator.
“Most days, if you’re aware enough to give yourself a choice, you can choose to look differently…”
Do you consider volatility to be a constant, potential opportunity or an off-putting, periodic albatross?
Bloom Off the Rose?
Let’s evaluate some recent undercurrents of uncertainty. The relatively strong performance of broad-based equity indexes, like the S&P 500® Index, have camouflaged some significant drawdowns in specific areas.
A variety of the hot IPOs (many of them coming to market via special purpose acquisition companies, or SPACs) are in the midst of meaningful pullbacks. Clean energy stocks that soared last year have been flagging. Electric vehicle upstarts like Nikola (NKLA) have been hammered. Even the bellwether EV company, Tesla (TSLA) has sold off about 40% from the late January highs at $900/share.
Other glittery tech names from 2020 have come under pressure as well. Unity (U), Palantir (PLTR), Agora (API) and C3ai (AI) have each lost at least 50% of their value relative to previous highs.
2020 Hot IPOS: Percentage Below High

As of May 26, the S&P 500 Index is fractionally higher for the month of May, but sector performance is very mixed. Energy is up about 4% (was up 10% mid-month) whereas Consumer Discretionary is down about 5%, Utilities are lower by 2.6%, and Information Technology has lost roughly 1%.
Cryptocurrencies, which experienced parabolic moves into early April and May, have sold off hard. Bitcoin (BTC) lost more than 50% of its market cap between April 14 and May 19. In price terms, BTC moved from nearly $65k to just over $30k in five weeks. Ethereum (ETH), the second largest crypto, fell 42% in just over a week.
Here’s a look at the total market capitalization of the global cryptocurrency market year-to-date:
Year-To-Date Global Cryptocurrency Total Market Capitalization

On May 10 and 11, with Ethereum making highs, the total value for the crypto market was over $2.5 trillion. That measure fell to $1.35 trillion intraday on May 19. That’s a profound amount of value eviscerated in just eight days. The market found support following a tweet from Elon Musk, which speaks to an unusual amount of sway from a single market participant (granted TSLA bought $1.5 billion for their balance sheet).
Context paints a more complete picture. Canada has the ninth largest economy in the world in nominal GDP terms. Canadian GDP is estimated to be $1.8 trillion in 2021. India has the seventh largest economy and an estimated GDP around $2.8 trillion. At its highs, the crypto market was worth somewhere between the economic output of Canada and India in 2021.
For another frame of reference, intellectual property (issuance and licensing) drives nearly 40% of the United States GDP ($22.7 trillion in 2021). According to the Global IP Center, the collective value of all-American IP is worth about $6.6 trillion.
Awareness
In one part of This is Water, Wallace points out that it’s important to thoughtfully consider what we pay attention to and why. From the perspective of a crypto outsider/observer, the combination of a market that had moved in one direction for a considerable length of time and the apparent dogmatic belief (from many) that it would continue is problematic.
In fairness, long-time crypto acolytes have been rewarded. Bitcoin has been incredibly volatile, but also remarkably resilient. The sentiment around crypto has shifted in recent years, but some of the “institutional acceptance” narrative may have been overblown.
In a J.P. Morgan research note quoted in the WSJ, J.P. Morgan argues that roughly $11 billion in crypto inflows stemmed from institutions between late 2020 and early 2021. Over the same time frame, the crypto market added more than $800 billion in market cap.
Individuals, with varying degrees of fundamental crypto/broad market knowledge, have piled into risky assets over the past year. While BTC/ETH/et all are examples, the degree to which (unregulated) crypto exchanges allow traders/investors to leverage their exposure is also unique. Portfolio implosions are frequently a toxic mix of asset/macro volatility and significant leverage. These fast-acting adjuvants can decimate one’s bottom line with breathtaking velocity.
I’m reminded of risk managers who would point out that: “you can be wrong often; but if you’re wrong and sized incorrectly (massive leverage) you may be looking for other work.”
Getting Out is Hard
The risk of “blind certainty,” as Wallace argues is “a closed-mindedness that amounts to an imprisonment so total that the prisoner doesn’t even know he or she is locked up.” This applies to far more than just crypto “HODLers.”
Markets are bi-directional. That reality tends to benefit those with a pre-established plan for entry and exit. I have learned the hard way how problematic the mental calisthenics can be when one chooses to turn an opportunistic position into a long-term investment, simply because the market didn’t do what I anticipated.
As Wallace eloquently states: “A huge percentage of the stuff that I tend to be automatically certain of tends to be totally wrong and deluded.”
Correlations
Modern portfolio theory and a long history of historical data posits that U.S. Treasuries (10-Year futures) and the S&P 500 Index tend to be negatively correlated. That’s often the case, but not always as you can see in the visual below.
60-Day Correlation Between S&P 500 Index Futures and 10-Year U.S. Treasury Note Futures

On a 60-day basis, the relationship between the U.S. 10-year futures (price) and the benchmark equity index is as positive as it has been since late 1999. In other words, the tendency lately has been that when bond futures move higher (yields lower) so too does the broad market and vice versa. That environment is detrimental for risk-parity strategies and other diversification efforts that are fundamentally driven by the expectation of an inverse correlation between bonds and equities.
The jump in commodity prices off the pandemic lows has been well documented. Prices are reacting to a supply/demand component, particularly in construction. There’s also massive monetary and fiscal stimulus that puts downward pressure on currencies like the U.S. Dollar. Most commodities are dollar denominated. On a related note, the long-term positive correlation between the MSCI Emerging Markets Index and the CRB Raw Industrials Price Index is fascinating.
Emerging market economies are often driven by commodity exports/demand. As a consequence, the MSCI Emerging Markets Index has been booming alongside commodity values.
Emerging Markets MSCI Stock Price Index & Industrials Commodity Price Index

Listed options linked to the MSCI Emerging Markets Index have been also been flourishing. An MSCI research piece from just over a year ago highlights the growth in structured options strategies (i.e. put spread collars) in the Emerging Markets products. That growth has only increased over the past twelve months.
Cboe lists MXEF options, which are designed to track the MSCI Emerging Market Index. These options continue to set monthly trading volume records this year. The product offers market participants exposure to Chinese (37.54%), Taiwanese (14.56%), South Korean (13.41%), Indian (9.36%), Brazilian (4.61%), and other emerging market equities.
Emerging Market proxies tend to move with greater volatility than more developed markets. There can be periods of significant out/underperformance. Cboe’s MXEF options have a large notional value for efficient exposure. They are European styled (no early assignment risk), and they are also cash settled.
The ETF alternatives have a significantly smaller notional value, early assignment risk, and the ETF options physically deliver at expiration. There may also be potential tax benefits associated with index options when compared to ETF options, but you must consult with a tax professional.
For more about correlation, check out this week’s Simply Put below.
Pain at the Pump
When commodities like copper, lumber, or vegetable oil rally, some people pay attention, but on a relative scale, they are niche markets. Gasoline, however, is widely consumed. As such, when average gas prices increase, consumers tend to take note.
Wallace calls attention to it in his own inimitable way: “There happens to be whole large parts of adult American life that nobody talks about in commencement speeches. One such part involves boredom, routine, and petty frustration” … like filling up the gas tank.
AAA National Average Gasoline Price

The national average for gasoline moved beyond the $3.00/gallon mark in May. That means, on average, the cost of gas is back at 6.5-year highs. The Colonial Pipeline hack that temporarily cut off roughly half of the supply of gasoline (and distillates) to the east coast certainly played a role. So, too, did the slowdown in refineries related to the pandemic economy. Refineries are unable to ramp up on demand.
Just over a year ago (April 2020), the average declined to $1.77/gallon. Keep in mind that very few people were driving, flying, and the transport of goods slowed significantly in the early stages of the pandemic. Gas prices can be a drag on economic activity, but many more people are employed, and the stimulus measures boosted savings, so the impact of this move may be muted relative to previous pain at the pump scenarios.
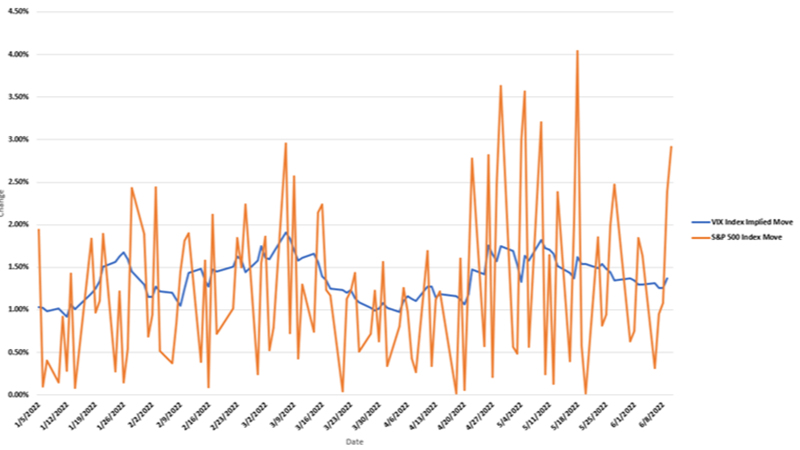
The VIX® Index
It wouldn’t be a proper volatility update without some mention of the VIX Index. Through May 25, the average VIX Index close this month was ~20.25. As of the same date, the SPX ATM options with 1-month until expiration were trading on a 14.5% implied volatility (IV). A 20 VIX level implies daily S&P 500 Index moves of ~1.25% (0.20/16). An ATM option trading on a 14.5% IV implies ~90 basis point moves daily.
Again, through May 25, on average, the S&P 500 Index has moved 77 basis points daily. Those vacillations are akin to the realized moves in March and January of 2021. A single 2+% move in the broad-based equity index can have an outsized impact on the realized (and implied) volatility measures for the product. The Options Institute also puts out a weekly update and the linked version highlighted the unusual jump in the VIX Index (+26%) as it related to the 2.15% decline in the S&P 500 Index on May 12.
The graph below highlights the weekly VIX options volumes going back one year. Volumes in 2021 are exceptionally strong. During the week ending May 14, ADV for VIX options ran one million for the first time since late March 2020 (pandemic lows). You may also notice that the call (green)/put (red) relationship has moved back into the more “normal state”. In other words, far more VIX call options have been trading of late than puts.
The VIX Index Calls vs. Puts

In October and November of last year VIX puts were trading more actively as the VIX futures curve slowly normalized, which accelerated following the election in early November.
The Path Ahead
So, as we approach the Dog-Days of a summer that may be more “normal” than the previous one, I’m planning on “simply paying attention to what’s going on in front of me (instead of what’s going on inside of me),” something Wallace recommends in his speech. He continues, “Learning how to think, really means learning how to exercise some control over how and what you think.”
I’ll make a daily effort to recognize the pervasive uncertainty and embrace the ebbs and flows of volatility. I’ll also consider the exceptional sacrifices that so many have made to stem the tide of a deadly pathogen. Thank you all.
The “freedom” we experience this summer is a testament to people “being able to truly care about other people and to sacrifice for them, over and over, in myriad petty little unsexy ways”.
Though much has changed over the past year, the impact of the coronavirus pandemic will likely reverberate for years to come. When uncertainty or volatility is present, most people’s “default setting” is fear. As with control of our thoughts, control of our investment decisions can be empowered by tools. VIX futures and options prioritize choice and flexibility and may offset preexisting volatility risk, while also altering your awareness.
“Simple awareness – of what is so real and essential, so hidden in plain sight all around us, that we have to keep reminding ourselves over and over:
This is Water.
This is Water”.
David Foster Wallace
Kenyon College
May 21, 2005
Volatility News
- Schaeffer's Research: Was Last Week's VIX Spike Warranted?
- CNBC: The VIX is flashing signs of more market downside, Jim Cramer says
- ETF Trends: VIX ETFs Spike as Risk Trades Unravel
- TheStreet: A Better Way To Invest? XVOL Offers The S&P 500 With A Built-In VIX Hedge
- Schaffer’s Market Mashup: Adam Warner and the VIX in 20 Minutes
Events
- June 12: Options for Overwriting and Mid-Year Index Reconstitutions
- Webinar Replay: Introduction to the VIX index and how investors can use it
Volatility411
Get the Inside Volatility Trading newsletter directly in your inbox by signing up here.
The information in this article is provided for general education and information purposes only. No statement(s) within this article should be construed as a recommendation to buy or sell a security [or futures contract, as applicable] or to provide investment advice. Supporting documentation for any claims, comparisons, statistics or other technical data in this article is available by contacting Cboe Global Markets at www.cboe.com/Contact.
Past Performance is not indicative of future results.
Futures trading is not suitable for all investors, and involves the risk of loss. The risk of loss in futures can be substantial and can exceed the amount of money deposited for a futures position. You should, therefore, carefully consider whether futures trading is suitable for you in light of your circumstances and financial resources. For additional information regarding futures trading risks, see the Risk Disclosure Statement set forth in the Risk Disclosure Statement set forth in Appendix A to CFTC Regulation 1.55(c) and the Risk Disclosure Statement for Security Futures Contracts.
This e-mail has been sent to you because you: 1) are a current or former subscriber to cboe.com; 2) have requested information from Cboe in the past; or 3) have been identified as an investment professional with interest in the subject matter.
Cboe®, Cboe Global Markets®, CFE®, Cboe Volatility Index®, and VIX® are registered trademarks and Cboe Futures Exchange™ and Mini VIXTM are service marks of Cboe Exchange, Inc. or its affiliates. Standard & Poor’s®, S&P®, S&P 500®, and SPX® are registered trademarks of Standard & Poor’s Financial Services, LLC, and have been licensed for use by Cboe Exchange, Inc. All other trademarks and service marks are the property of their respective owners.
Options involve risk and are not suitable for all investors. Prior to buying or selling an option, a person must receive a copy of "Characteristics and Risks of Standardized Options." Copies are available from your broker or from The Options Clearing Corporation at 125 S. Franklin Street, Suite 1200, Chicago, IL 60606 or at www.theocc.com.
© 2021 Cboe Exchange, Inc. All Rights Reserved.
Related Posts