Lighting up the Dark: Hidden Trends In Off-Exchange Trading
Asad Bhatti
▬
July 15, 2020
The fragmentation of equity markets has caused market centers to evolve in recent years, each with their own distinct characteristics. With 13 live public exchanges (soon to be 16), over 30 Alternative Trading Systems (ATS) — electronic trading venues that match buyers and sellers without displaying a public quote — and multiple other ‘off-exchange’ market centers, equity market participants have a slew of options for optimal execution. The variety of choice makes the decision even more complex, and as a result competition continues to grow between exchanges and off-exchange market centers.
There has been a substantial increase in the amount of trading on the Trade Reporting Facilities (TRF) since the spike in market volatility in March 2020, as illustrated in the chart below. In May, this activity averaged near 42% and the trend continued in June (excluding event days, which tend to cater toward closing auctions

FINRA Data
On a post trade basis, data for TRF activity is published by FINRA. This reporting is aggregated by symbol and market participant identifier. FINRA classifies this volume into two broad categories:
- Alternative Trading Systems (ATS)
- Non-ATS OTC
The data generally shows the majority of trading is in the non-ATS category, which comes from broker dealers that execute a client order away from the public markets. Only about 11–12% of market volume is executed on ATSs, meaning this is not driving the recent rise in TRF trading. Figure 2 below demonstrates that there has been very little change in ATS market share and the non-ATS volumes constitute a larger portion of trades reported on TRFs. Non-ATS volume has grown from around 25% at the start of the year to nearly 35% in May.

Much of the non-ATS volume flow executed off-exchange is traded in a principal capacity, meaning the contra-party is a single firm, which differs from the multi-lateral nature of an ATS or a public exchange. Although the FINRA data does not provide a description of the type of non-ATS trading center, many of them execute retail orders (wholesalers) or not held orders, typically using Indications of Interest to attract order flow (Single Dealer Platforms / Enhanced Liquidity Providers / Central Risk Books). Much of this order flow is not directly accessible for all market participants.
Non-ATS Breakdown
In addition to identifying firms in the non-ATS category, FINRA also allows certain firms to report under a broad category called De Minimis Firms. To be included in this category, the firm must report less than 200 transactions a day during the reporting period. Recent trends show an increase in non-De Minimis firms trading, indicating fewer firms are meeting the De Minimis firm criteria. Although the level of transparency for off-exchange trading has increased, more may be required to provide greater clarity into the recent trends1, and proposals to expand this visibility further have been a step in the right direction2. Overall, most of the Non-ATS executions that take place off-exchange are a result of manually pairing two customer orders or risk filling/committing capital for a client order.

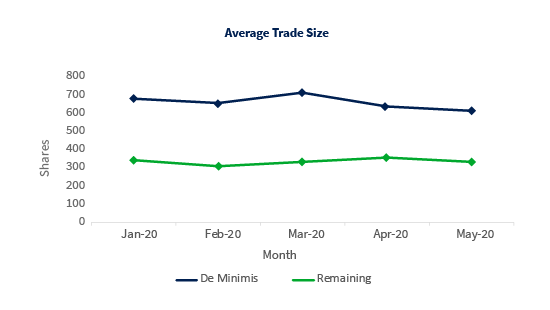
Average Trade Size
Taking a closer look at this data, the average trade size, when measured by Non-ATS participants, shows interesting trends. The average ATS trade size is just under 200 shares. In the non-ATS category the average is closer to 300. De Minimis firms have the highest average trade size, nearing 600 shares. Figure 4 below illustrates that these trends shifted slightly during recent increased TRF activity, which may indicate that some firms are no longer defined as De Minimis.
On the whole, having more destinations to trade at is generally a healthy sign for the market. More competition among marketplaces improves customer experience; however, increased transparency is important for marketplaces in order to foster a competitive landscape. Increasing transparency into TRF volume, as previously proposed by FINRA, is a welcome step toward shedding more light into understanding the value proposition of this market segment. For example, market centers not defined as ATS could be represented by an MPID specific to the type of market center they represent (i.e. Single Dealer Platform).
In 1996 the SEC recognized the value of limit orders being displayed and implemented a rule to enhance the NBBO, but little has been done since to update this obligation. Retaining the value of the public quote is crucial to ensuring appropriate price discovery for investors. It will also allow all marketplaces to compete on an even playing field, ultimately benefiting all customers.
Cboe continues to innovate and compete through unique offerings, like our launch of Retail Priority and recently released enhanced Midpoint Discretionary Order (MDO) functionality, Quote Depletion Protection (QDP).
2020 Cboe Exchange, Inc. All rights reserved.
The information in this letter is provided for general education and information purposes only. No statement(s) within this letter should be construed as a recommendation to buy or sell a security or to provide investment advice. Supporting documentation for any claims, comparisons, statistics or other technical data in this letter is available by contacting Cboe Global Markets at www.cboe.com/Contact.
Related Posts