Key Cboe Benchmark Indexes Using SPX Options Offer Strong Risk-Adjusted Returns
January 17, 2019
Following a decline in the S&P 500® Index of 6.9% in October and a drop of 9.2% in December, more investors appear to be exploring income-producing strategies that have the potential for relatively strong risk-adjusted returns amid increased market volatility.
To help investors with that process, Cboe offers 10 benchmark indexes designed to measure the hypothetical returns of strategies that use S&P 500 (SPX(SM)) options, with daily data histories beginning in mid-1986.
HIGHER OPTIONS PREMIUMS RECEIVED WITH CASH-SECURED PUT WRITING
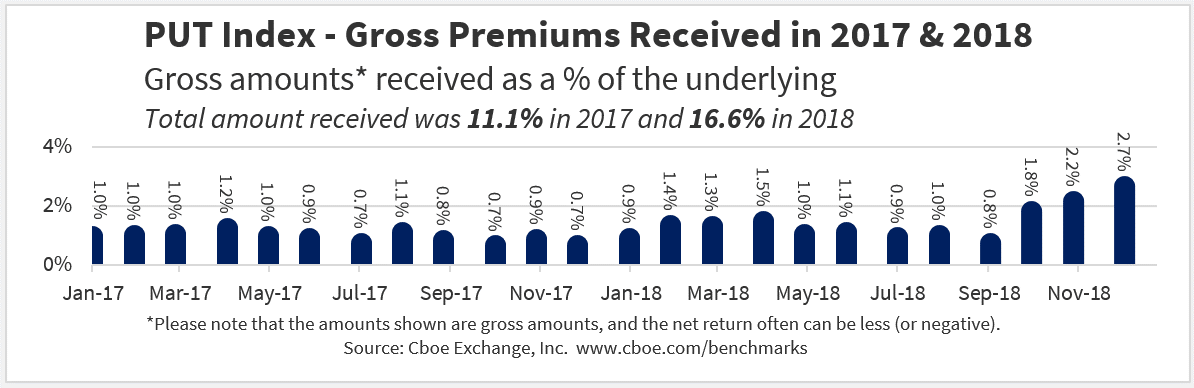
The first two charts below show the gross premiums (as a percentage of the underlying value) received by two indexes that are designed to show the performance of cash-secured put-writing strategies: the Cboe S&P 500 PutWrite Index (PUT(SM)), which sells SPX options once a month, and the Cboe S&P 500 One-Week PutWrite Index (WPUT(SM)), which sells S&P 500 options once a week.
The aggregate amount of premiums received in 2018 was 16.6% for the PUT Index and 35.6% for the WPUT Index. In December 2018 the S&P 500 volatility (and premiums collected by the PUT and WPUT indexes) rose to some of their highest levels in recent years.

HIGHER RISK-ADJUSTED RETURNS FOR CERTAIN BENCHMARK INDEXES THAT SELL SPX OPTIONS
Two of the most popular gauges for risk-adjusted returns are the Sharpe Ratio and the Sortino Ratio. The next two charts show that, over a period of 32.5 years, four Cboe benchmark indexes that sell SPX options – PUT, CMBOSM, BXMDSM and BXMSM – all had higher Sharpe Ratios and Sortino Ratios than (1) “traditional” indexes such as the S&P 500, MSCI EAFE, and S&P GSCI indexes, and (2) the option-buying Cboe S&P 500 5% Put Protection Index (PPUTSM).

Some analysts suggest that index-option-selling strategies have had stronger risk-adjusted returns than index-option-buying strategies because of the existence of an implied volatility risk premium – implied volatility generally has been higher than realized volatility for SPX options in most years (except 2008) over the last two decades.
One caveat to use with the Sharpe Ratio is the fact that it assumes a normal distribution of returns, and the indexes in the charts below have negative skewness in their returns. Past white papers by Ibbotson Associates, by Callan Associates and by Professor Oleg Bondarenko also have used the Stutzer Index as a skew-adjusted measure of risk-adjusted returns and found that with the Stutzer Index, indexes such as the BXM or PUT still have had strong risk-adjusted returns.
HIGHEST RETURNS FOR CBOE BXMD INDEX
The next chart shows that the Cboe S&P 500 30-Delta BuyWrite Index (BXMD) had cumulative returns of 2265% since mid-1986. The cumulative returns for the BXMD were 13% higher than those of the S&P 500 Index, and quite a bit higher than the other eight indexes on the chart.

RETURNS AND VOLATILITY
The PUT and CMBO indexes that sell SPX options performed relatively well on both the annualized returns and standard deviations charts below.

MORE INFORMATION
To learn more about ways in which index options and volatility products can be used in portfolio management, please visit these links:
- www.cboe.com/benchmarks Cboe’s strategy benchmark indexes, and related research papers by Wilshire and other firms
- www.cboe.com/SPX S&P 500 index options
- www.cboe.com/funds Funds that use options
- www.cboe.com/strategies Options strategies
- www.cboe.com/education Options education
- www.cboeRMC.com Cboe Risk Management Conferences in California and Germany
The information in this post is provided for general education and information purposes only. No statement(s) within this post should be construed as a recommendation to buy or sell a security or to provide investment advice. Supporting documentation for any claims, comparisons, statistics or other technical data in this post is available by contacting Cboe Global Markets at www.cboe.com/Contact. Past Performance is not indicative of future results. The views expressed herein are those of the author and do not necessarily reflect the views of Cboe Global Markets, Inc. or any of its affiliates. Options involve risk and are not suitable for all investors. Prior to buying or selling an option, a person must receive a copy of “Characteristics and Risks of Standardized Options.” Copies are available from your broker or from The Options Clearing Corporation at One Wacker Drive, Suite 500, Chicago, IL 60606 or at www.theocc.com. © 2019 Cboe Exchange, Inc. All Rights Reserved.
Related Posts